BE-IIS-HPP-T1S UDP Throughput versus SPI Clock Frequency
10BASE-T1S (IEEE 802.3cg) enables 10 Mbit/s Ethernet communication over a single twisted pair and supports multidrop network topologies.
The BE-IIS-HPP-T1S provides a 10BASE-T1S interface for Raspberry Pi systems based on the Microchip LAN8651 Ethernet MAC-PHY. The MAC-PHY communicates with the Raspberry Pi over SPI.
This test investigates how the requested SPI clock frequency affects the achievable 10BASE-T1S UDP throughput.
The purpose is not to determine only whether the Ethernet link comes up. The purpose is to identify the point at which the SPI connection between the Raspberry Pi and the LAN8651 becomes the performance bottleneck.
Key Features
- IEEE 802.3cg compliant 10BASE-T1S interface
- Microchip LAN8651 10BASE-T1S MAC-PHY
- Galvanically isolated MDI interface
- Raspberry Pi HAT+ compliant (2024)
- Stackable HAT design for the BE-IIS HAT++ ecosystem
- Configurable chip-select and IRQ routing
- Optional PoSPE companion-board support
- Two connector options
- Linux driver and Device Tree integration
- Open test scripts and reproducible setup
Test Objective
The standard Device Tree configuration of the BE-IIS-HPP-T1S requests an SPI frequency of 20 MHz:
spi-max-frequency = <20000000>;
For this test, the requested frequency was reduced in steps of 1 MHz:
20 MHz
19 MHz
18 MHz
...
6 MHz
5 MHz
At every frequency, one Raspberry Pi transmitted UDP traffic continuously with an iperf3 target rate of 10 Mbit/s.
The second Raspberry Pi received the traffic and recorded:
- received throughput
- UDP packet loss
- jitter
- transmitted packet count
- lost packet count
- requested SPI frequency
The result of each test point was written to a CSV file.
Hardware Test Setup
The setup uses:
- 2 × Raspberry Pi systems
- 2 × BE-IIS-HPP-T1S HATs
- 1 × 10BASE-T1S single-pair connection
- 1 × separate management network for SSH control
Each Raspberry Pi is equipped with one BE-IIS-HPP-T1S HAT.
Raspberry Pi sender
+ BE-IIS-HPP-T1S
+ T1S address 10.10.10.1
        |
        | 10BASE-T1S single twisted pair
        |
Raspberry Pi receiver
+ BE-IIS-HPP-T1S
+ T1S address 10.10.10.2
The management network is used only to start the remote iperf3 client over SSH.
The actual test traffic is explicitly sent over the 10BASE-T1S network from 10.10.10.1 to 10.10.10.2.
This separation is important. It keeps the SSH connection available even if the tested SPI frequency becomes too low for usable T1S communication.
Software Test Setup
Both Raspberry Pi systems run Raspberry Pi OS 64-bit with the BE-IIS installer and the LAN865x Linux driver.
The T1S interface on the receiving system is available as:
ifconfig beiis-t1s0
The test uses the following network configuration:
Sender T1S address   : 10.10.10.1
Receiver T1S address : 10.10.10.2
Interface            : beiis-t1s0
UDP target rate      : 10 Mbit/s
Measurement time     : 20 seconds
Omitted warm-up time : 3 seconds
Automated SPI Frequency Sweep
A test script automates most of the measurement procedure.
For every test point, the script:
- reads the SPI frequency from the active Device Tree
- verifies the corresponding frequency in the overlay source
- checks the remote sender over SSH
- starts the local iperf3 server
- starts the UDP sender remotely
- records the receiver-side iperf3 JSON result
- appends the result to the CSV file
- reduces
spi-max-frequencyby 1 MHz - rebuilds and installs the Device Tree overlay
- requests a reboot before the next measurement
The reboot ensures that the next test uses the newly installed Device Tree configuration.
The script is intentionally started as the normal user:
./t1s_spi_sweep.sh
It requests elevated privileges only for the overlay installation.
It must not be started as:
sudo ./t1s_spi_sweep.sh
Running the complete script with sudo would change the home directory and SSH environment to the root user.
Example Test Cycle
At a requested frequency of 20 MHz, the script reads:
[INFO] SPI frequency
  Active device tree : 20000000 Hz (20.000 MHz)
  Overlay source     : 20000000 Hz (20.000 MHz)
It then runs the UDP measurement, writes the result to the CSV file, changes the overlay source to 19 MHz, rebuilds the overlay and asks for a reboot.
After reboot, the script is run again for the next frequency.
This process continues until the configured minimum frequency is reached or communication is no longer useful.
Throughput Results
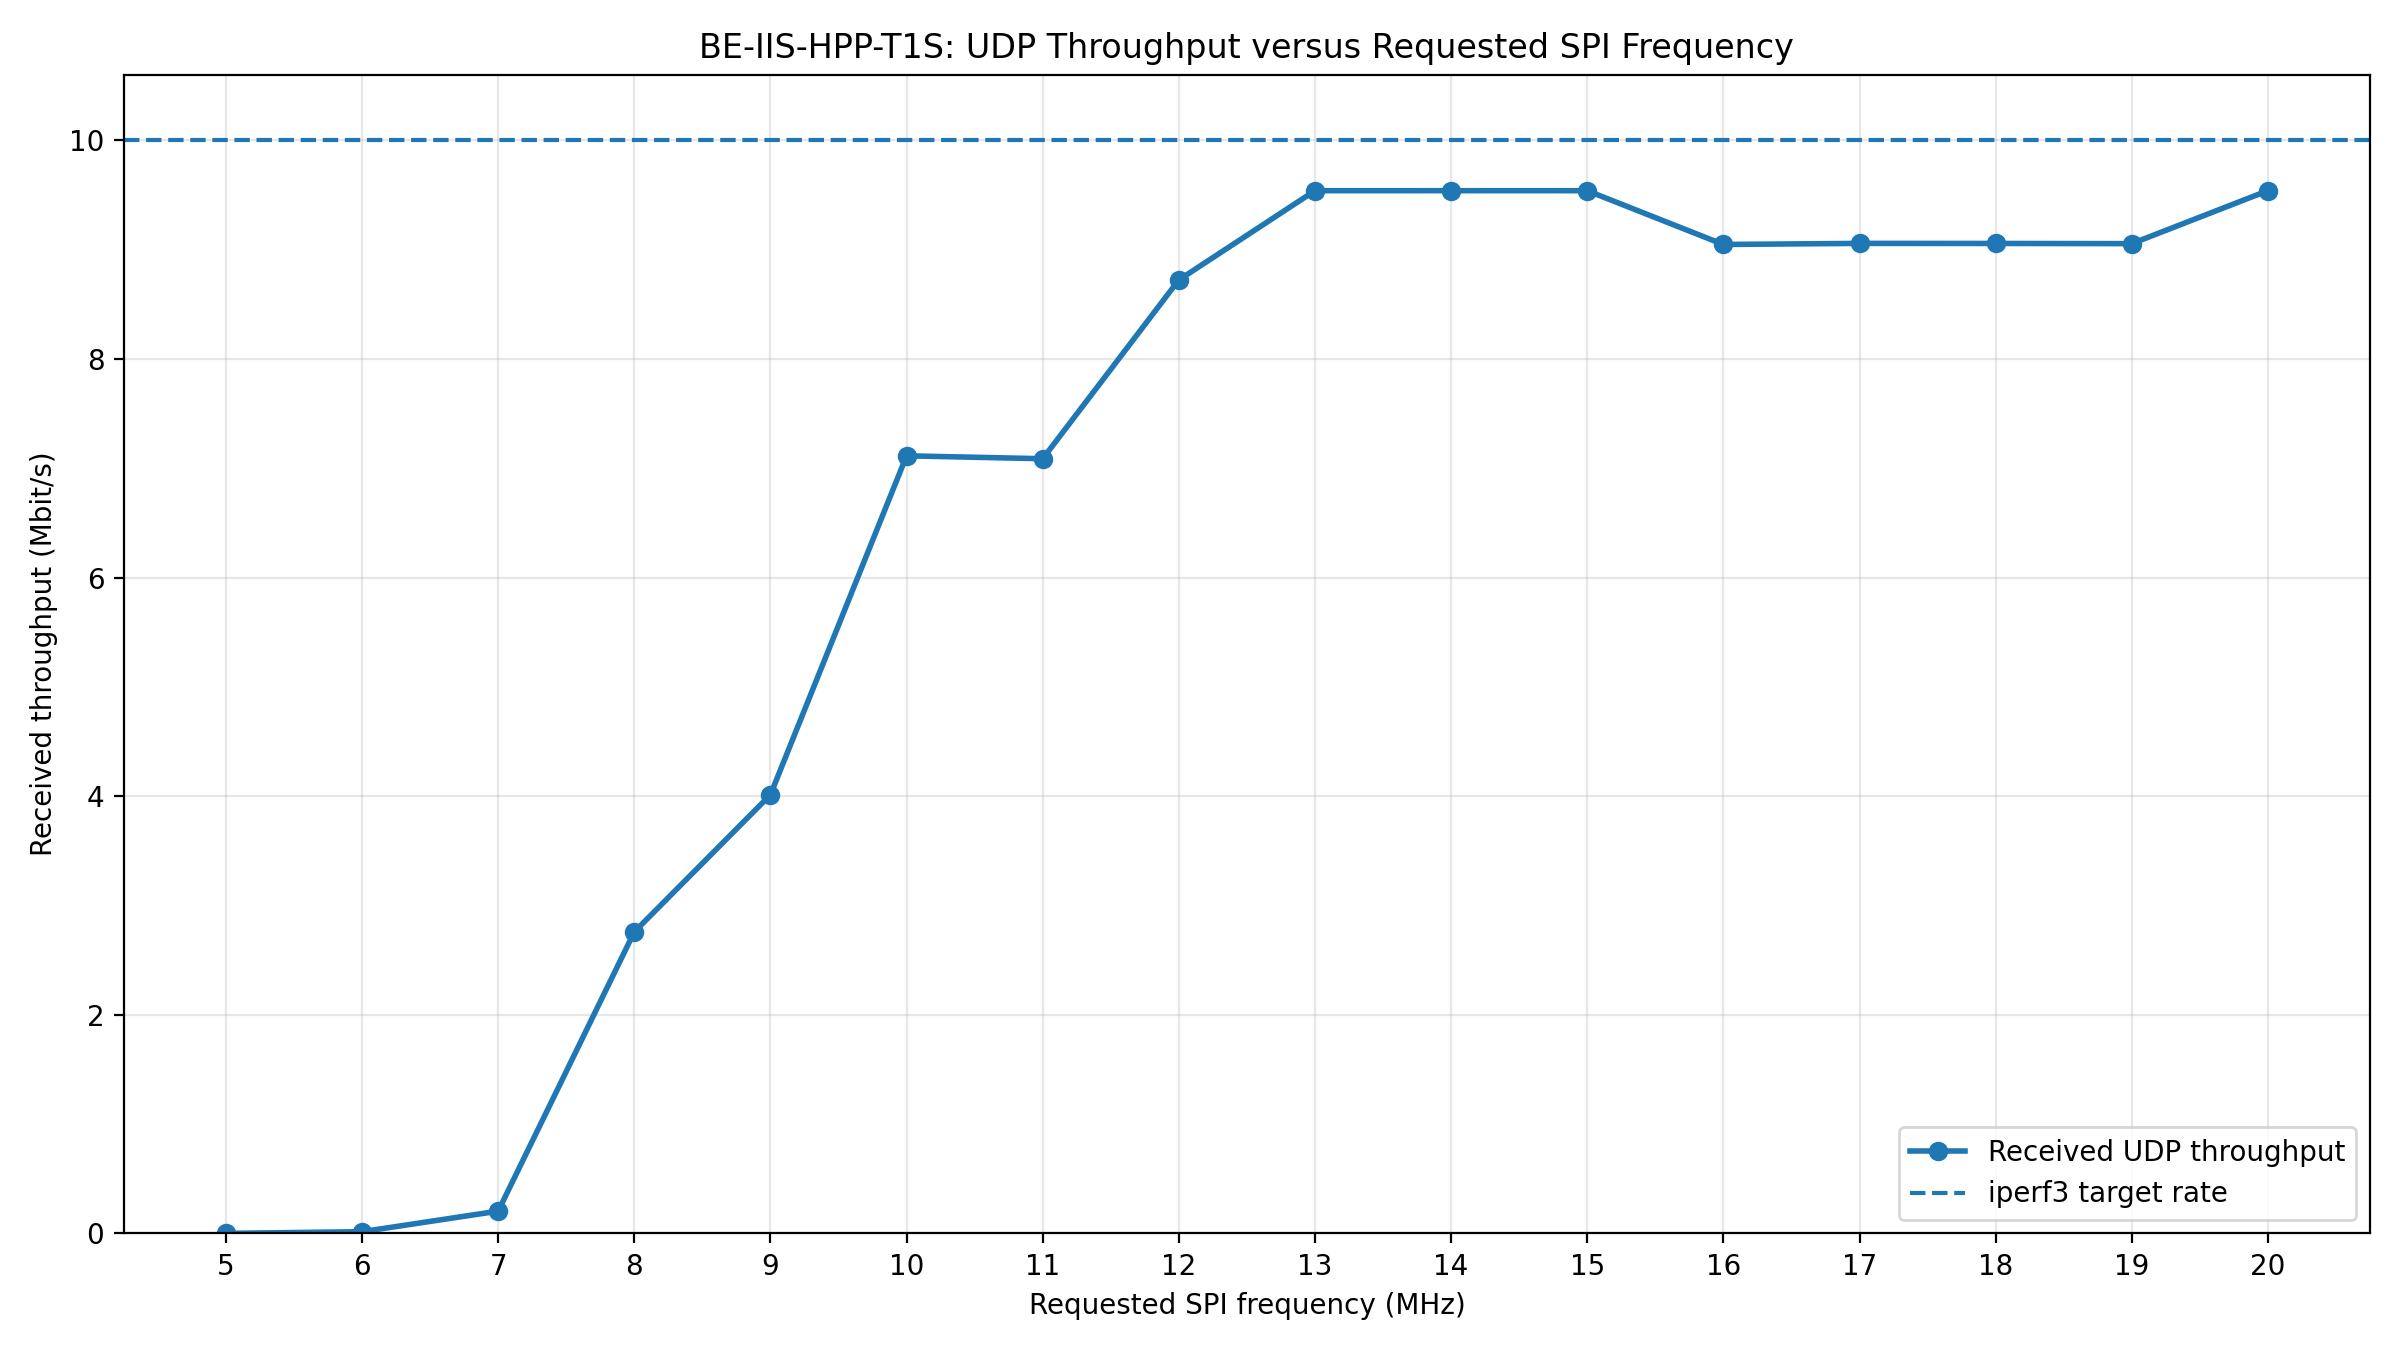
The following diagram shows the receiver-side UDP throughput.
The requested UDP rate was 10 Mbit/s.
At requested SPI frequencies from 20 MHz down to 13 MHz, the receiver measured between approximately 9.05 and 9.54 Mbit/s.
At 13 MHz, the result was still:
9.539 Mbit/s received
4.61% packet loss
At 12 MHz, the throughput started to decrease:
8.722 Mbit/s received
12.02% packet loss
At 11 MHz and 10 MHz, only about 7.1 Mbit/s reached the receiver.
Below 10 MHz, the throughput dropped rapidly:
9 MHz : 4.013 Mbit/s
8 MHz : 2.759 Mbit/s
7 MHz : 0.204 Mbit/s
6 MHz : 0.016 Mbit/s
5 MHz : 0.001 Mbit/s
Packet-Loss Results
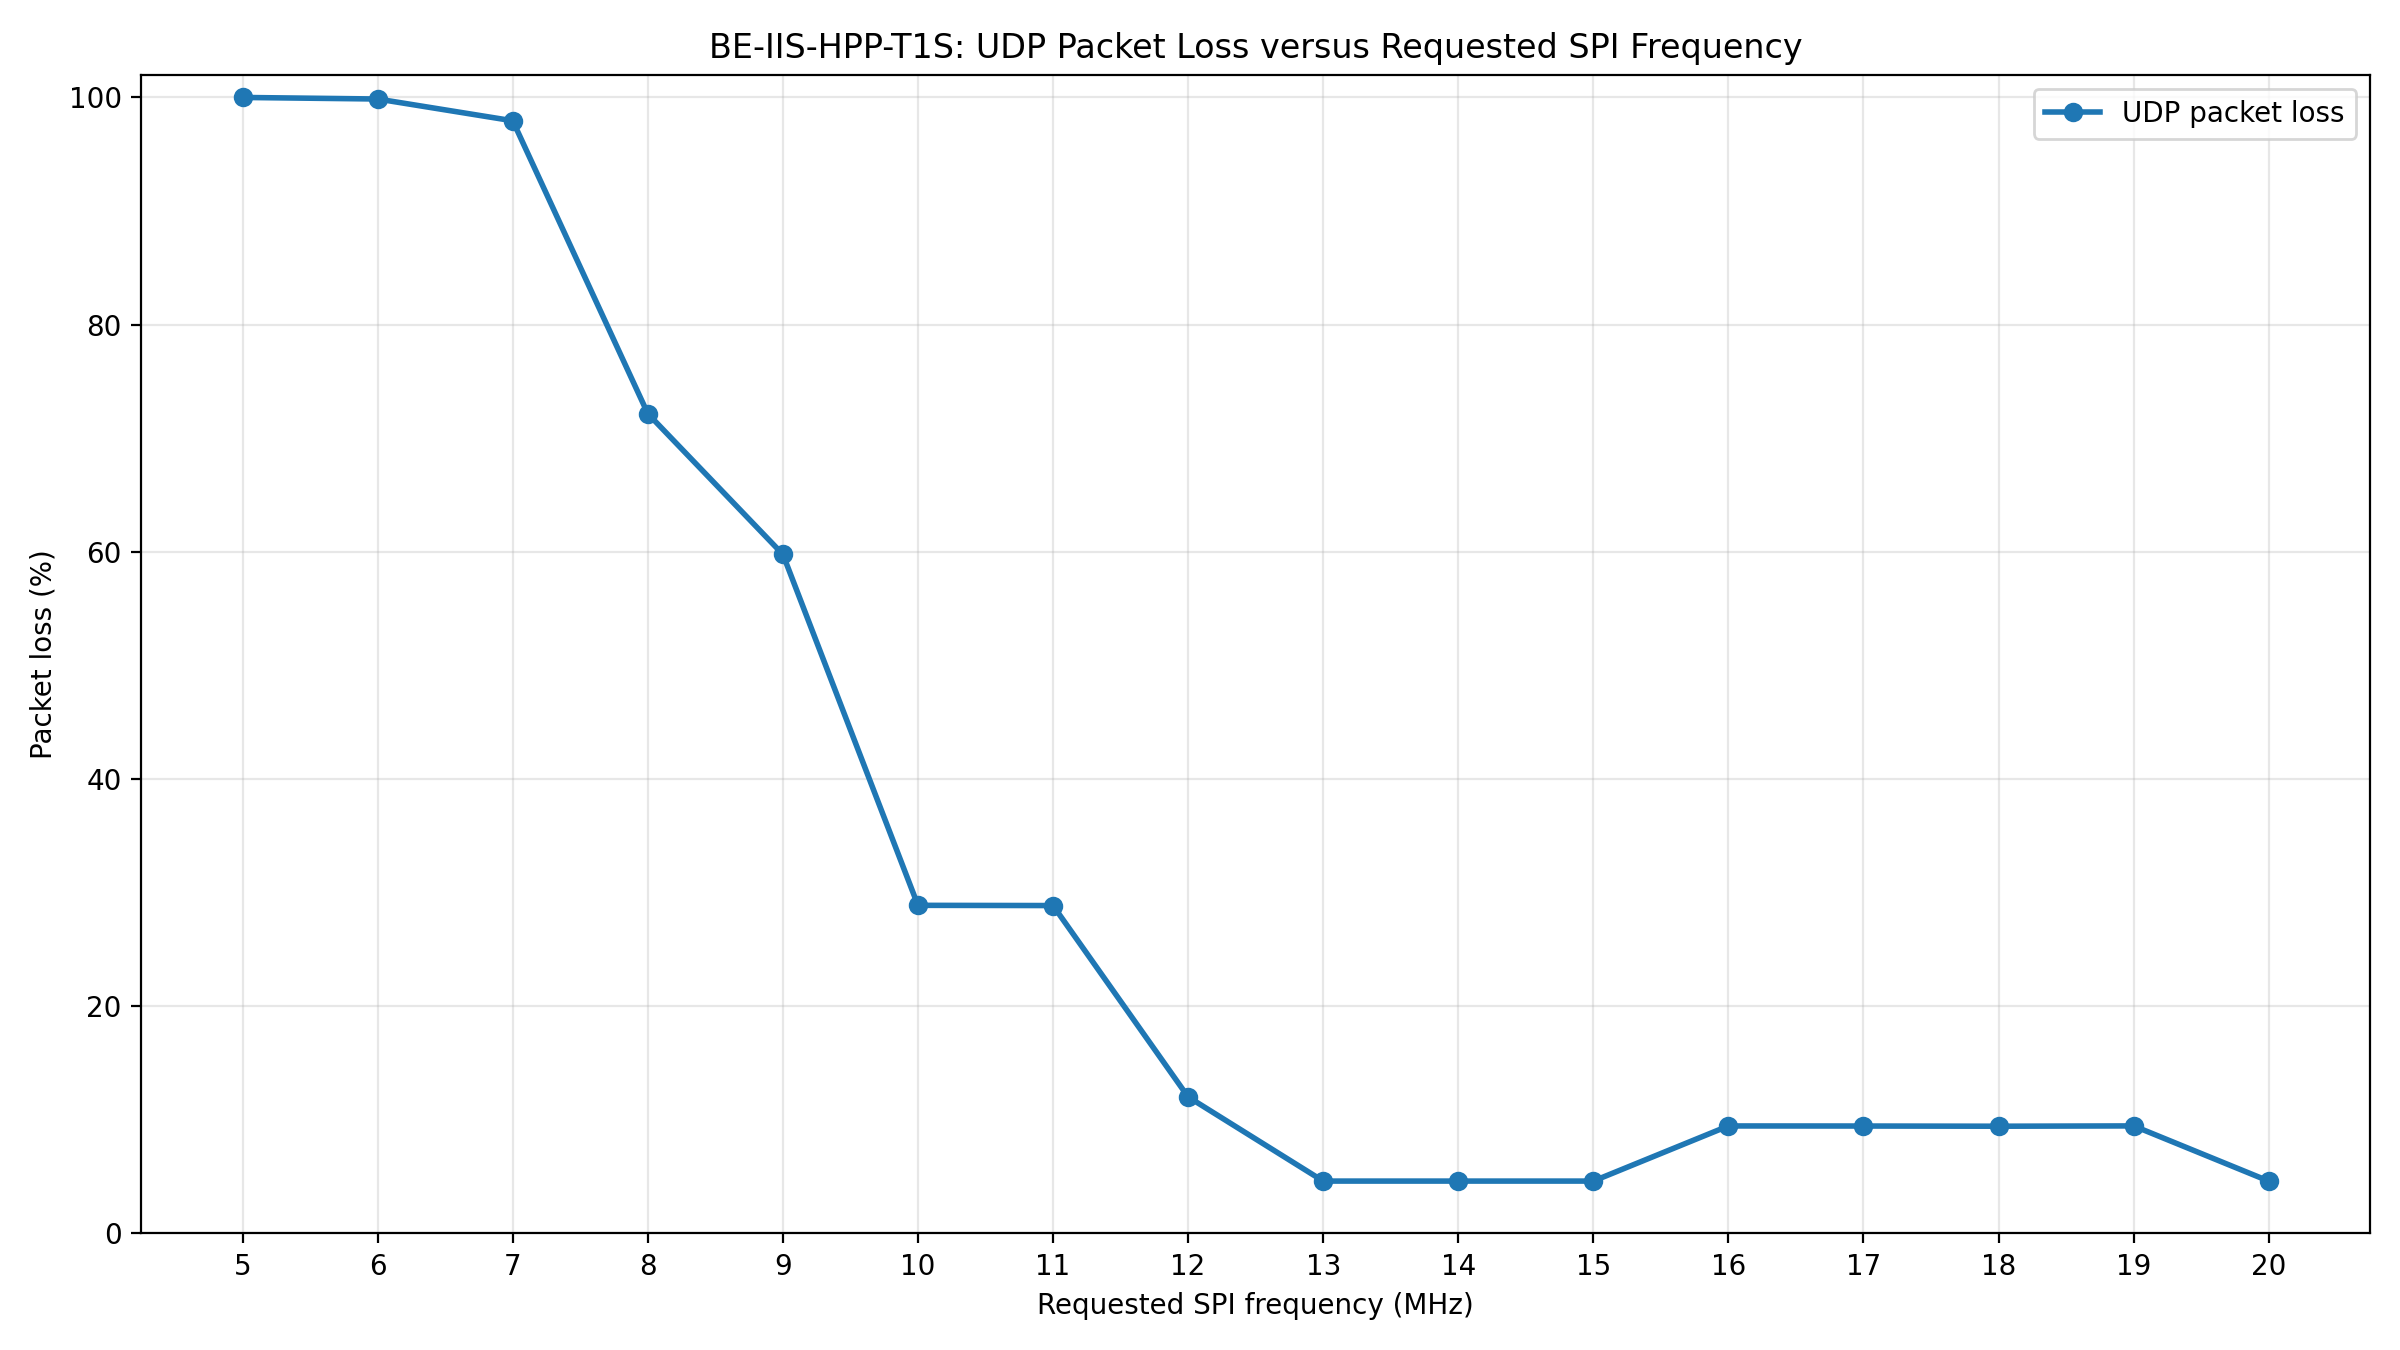
At the higher SPI frequencies, the remaining packet loss is partly caused by the selected 10 Mbit/s UDP target rate.
UDP does not automatically reduce its transmission rate and does not retransmit lost packets. In addition, Ethernet and protocol overhead must also be transported. Therefore, a 10 Mbit/s UDP payload target is close to or above the practical payload capacity of a 10 Mbit/s physical link.
For this reason, the approximately 4.6% loss measured at the best test points should not be interpreted as an SPI limitation by itself.
The more important observation is the additional loss that appears as the requested SPI frequency is reduced.
At 12 MHz, packet loss increased to approximately 12%.
At 10 MHz and 11 MHz, it increased to approximately 29%.
At 9 MHz, approximately 60% of the UDP packets were lost.
At 7 MHz and below, almost all packets were lost.
Complete Measurement Results
| Requested SPI frequency | Received throughput | Packet loss | Jitter |
|---|---|---|---|
| 20 MHz | 9.539 Mbit/s | 4.61% | 0.057 ms |
| 19 MHz | 9.054 Mbit/s | 9.47% | 0.106 ms |
| 18 MHz | 9.056 Mbit/s | 9.44% | 0.101 ms |
| 17 MHz | 9.057 Mbit/s | 9.46% | 0.145 ms |
| 16 MHz | 9.047 Mbit/s | 9.46% | 0.100 ms |
| 15 MHz | 9.539 Mbit/s | 4.61% | 0.118 ms |
| 14 MHz | 9.539 Mbit/s | 4.61% | 0.118 ms |
| 13 MHz | 9.539 Mbit/s | 4.61% | 0.093 ms |
| 12 MHz | 8.722 Mbit/s | 12.02% | 0.136 ms |
| 11 MHz | 7.087 Mbit/s | 28.86% | 0.504 ms |
| 10 MHz | 7.113 Mbit/s | 28.88% | 0.420 ms |
| 9 MHz | 4.013 Mbit/s | 59.77% | 1.149 ms |
| 8 MHz | 2.759 Mbit/s | 72.16% | 0.795 ms |
| 7 MHz | 0.204 Mbit/s | 97.94% | 0.896 ms |
| 6 MHz | 0.016 Mbit/s | 99.86% | 4.837 ms |
| 5 MHz | 0.001 Mbit/s | 99.99% | 0.000 ms |
The complete CSV file is available here:
Download the complete T1S SPI sweep CSV data
Interpretation
The test shows three practical operating regions.
13 MHz to 20 MHz: Full T1S Throughput
Within this range, the SPI connection is fast enough to support approximately the complete practical UDP payload throughput of the 10BASE-T1S link.
The received results are not perfectly monotonic. For example, the measurements at 15 MHz, 14 MHz and 13 MHz are slightly better than the measurements from 19 MHz to 16 MHz.
This does not mean that a lower requested SPI clock is inherently faster.
spi-max-frequency defines the maximum requested device frequency. The Raspberry Pi SPI controller and driver can select only supported clock configurations and may round requested values. The actual SCLK waveform was not measured during this test.
Therefore, the x-axis should be understood as the requested maximum SPI frequency from the Device Tree, not as a precision measurement of the physical SPI clock.
Normal run-to-run variation can also influence a single UDP measurement.
10 MHz to 12 MHz: SPI Becomes the Bottleneck
At 12 MHz, the received throughput begins to fall below the practical T1S maximum.
At 10 MHz and 11 MHz, the receiver obtains only about 7.1 Mbit/s and loses approximately 29% of the packets.
In this range, the T1S physical link is still active, but the host-to-MAC-PHY SPI interface can no longer move packets fast enough for the configured 10 Mbit/s UDP traffic.
Below 10 MHz: Severe Throughput Limitation
At 9 MHz, throughput falls to about 4 Mbit/s.
At 8 MHz, it falls below 3 Mbit/s.
At 7 MHz and below, the connection may still technically pass a small number of packets, but it is no longer useful for normal 10BASE-T1S Ethernet operation at the tested traffic load.
The 5 MHz test completed with approximately:
0.000571 Mbit/s received
99.995% packet loss
This is effectively a complete throughput collapse for the selected workload.
Practical Result
For this hardware and software setup, a requested SPI frequency of 13 MHz was the lowest tested value that still provided the full practical 10BASE-T1S UDP throughput.
The default setting remains:
spi-max-frequency = <20000000>;
This provides substantial margin and should remain the normal production and evaluation setting.
The result is still useful for system design. It demonstrates that the default 20 MHz configuration is not operating directly at the observed throughput limit and that the LAN8651 SPI connection has measurable margin in this setup.
Test Limitations
This test is a practical engineering measurement and not a formal compliance test.
Important limitations include:
- one hardware setup
- one measurement per requested SPI frequency
- one UDP packet size and iperf3 configuration
- one Raspberry Pi software and kernel configuration
- no oscilloscope measurement of the actual SPI clock
- no long-duration stability test at every frequency
- no repeated statistical test series
- no temperature or voltage variation
A more detailed characterization could repeat every point several times and additionally measure the physical SCLK frequency, CPU load, interrupt load and SPI transfer timing.
Conclusion
The BE-IIS-HPP-T1S successfully transported near-full 10BASE-T1S UDP throughput while the requested SPI clock was reduced from 20 MHz down to 13 MHz.
The receiver measured approximately 9.54 Mbit/s at 13 MHz, which was effectively equal to the best result obtained at the default 20 MHz setting.
At 12 MHz, the throughput began to decrease. At 10 MHz and 11 MHz, the SPI interface limited the received throughput to approximately 7.1 Mbit/s. Below 10 MHz, throughput and packet delivery deteriorated rapidly.
The test therefore identifies a clear practical transition:
13 MHz and above : full practical T1S throughput
10–12 MHz        : increasing SPI limitation
below 10 MHz     : severe throughput limitation
The default 20 MHz Device Tree configuration provides a useful operating margin and remains the recommended setting.
The automated test procedure also makes the result reproducible. Overlay modification, rebuild, installation, reboot sequencing, iperf3 measurement and CSV logging are all handled by a transparent shell script stored with the product test resources.
Links and References
Product page, including datasheet, schematic, PCB layout, 3D data and shop links: https://www.be-iis.eu/products/BE-IIS-HPP-T1S_B/
BE-IIS installer and product software resources: https://github.com/be-iis/be-iis-installer/
SPI speed sweep test source: https://github.com/be-iis/be-iis-installer/tree/main/products/BE-IIS-HPP-T1S-REVB/test/spi-speed-sweep/
DigiKey product page: https://www.digikey.de/en/products/detail/brechel-electronic-industrial-interface-systems-be-iis/BE-IIS-HPP-T1S/29436902